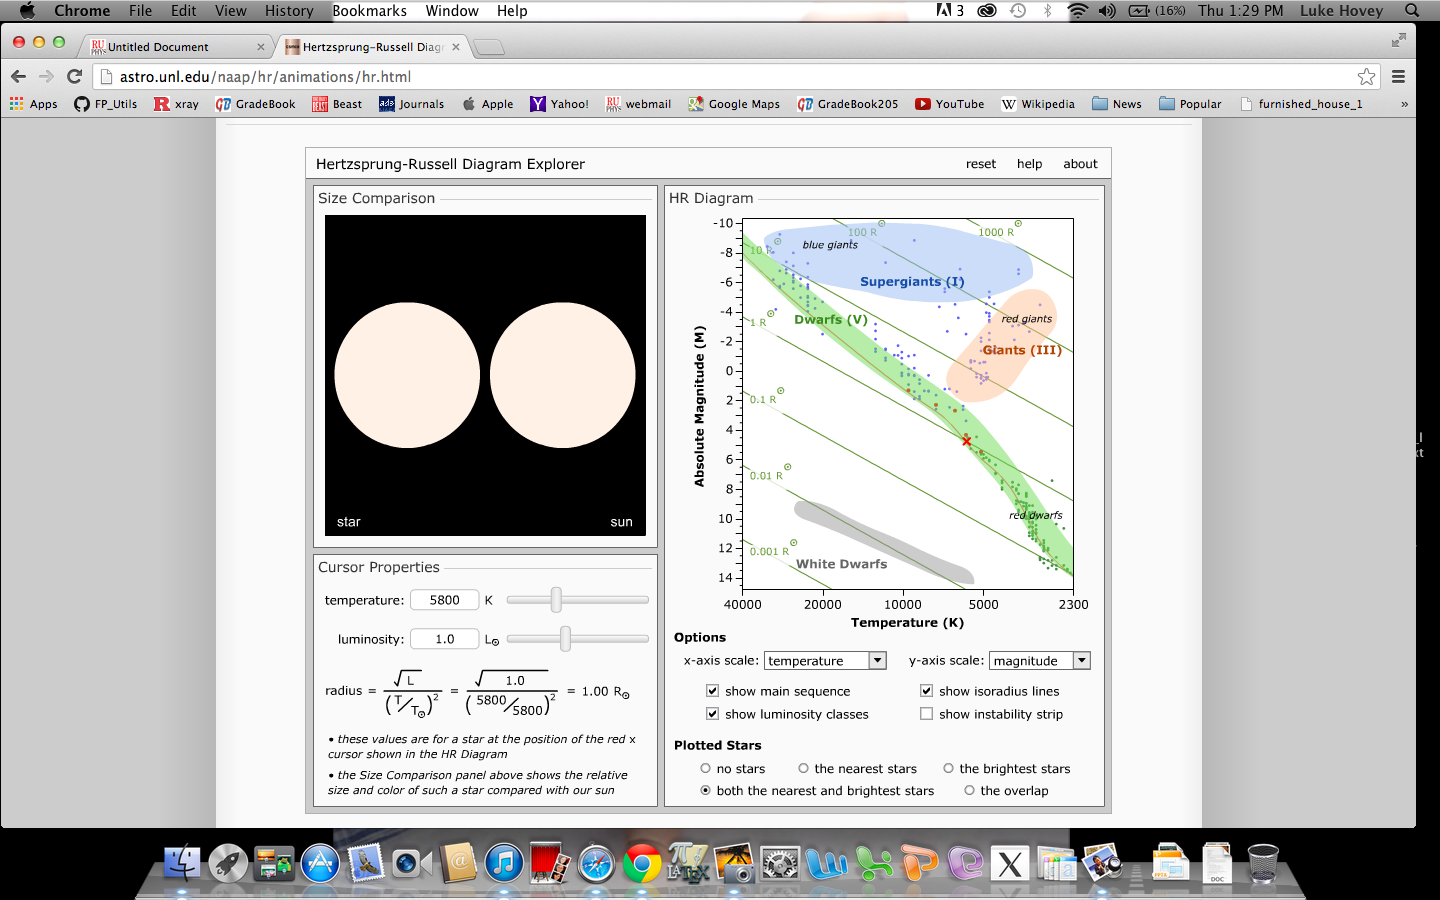
The astronomy department from the University of Nebraska-Lincoln hosts a great website with various educational resources, one of which is a very informative Interactive H-R Diagram. Let's take a closer look at this guide.
1. Open the Interactive H-R Diagram. Note that the red x appears initially at the position where the sun resides.
2. Select "magnitude" for the y-axis. Note that this is absolute magnitude , which quantifies the brightness of a star by telling you how bright it would appear if it were placed at a distance of 10 parsecs (32.6 light-years) from an observer on Earth. This gives a true measure of the power output of a star.
3. Next select "show luminosity classes" under options and leave the instability strip button unselected for now. Below these buttons are options for plotted stars. Select the "both the nearest and brightest stars" button so that your screen looks like mine below.

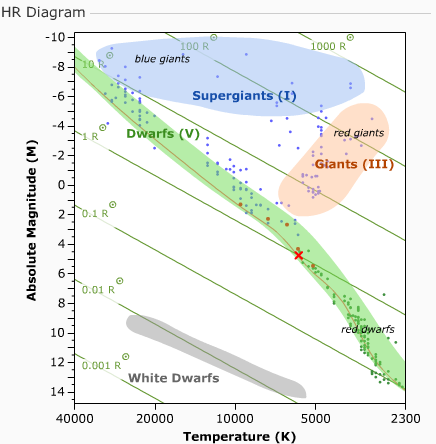
4. Let's discuss some of the many features of the H-R diagram that are displayed. The x-axis of the plot represents the temperature of a star (please note that the temperatures go from high to low if we look from left to right on the axis). This temperature scale is in Kelvin, which is similar to the centigrade scale in that a difference of 1 degree Celsius is equal to a difference of 1 degree in the Kelvin scale of temperature. However, zero (0) Kelvin is equal to about -273 degrees Celsius. Zero Kelvin is known as Absolute Zero, the temperature at which a gas would have zero energy, other than its own quantum fluctuations.
The green diagonal lines that run from top-left to bottom-right, are lines upon which stars have the same physical size (i.e. they represent lines of constant radius). If you look at the screen near the bottom left you will see the mathematical expression that relates a star's temperature and luminosity (magnitude) to its radius. The green band that also runs from top-left to bottom-right with a thin red line running through it is known as the "Main Sequence". These are stars in the prime of their life where they have achieved a stable balance between the gravitational force on the star that acts inward towards the fiery core, and the outward pressure changes resulting from the heat generated by fusion in the core. This balance is called Hydrostatic Equilibrium.
The top right of the diagram is where the Blue Supergiants reside. The Red Giant stars are immediately down and to the right of the blue supergiants, while the White Dwarf stars are shown as the gray band at the bottom of the H-R diagram. All of these groups are intimately related to the evolution of the main sequence stars, which are best described by two different paths that differ as a function of stellar mass.
